Case study 1 – Modelling the impact of climate variability on the cyclical satellite-based grassland growth rate
The impact of climate dynamics on grassland growth for a rural mountains region in northeastern Portugal was evaluated in this case study. As a measure of vegetation growth, we used the 1998-2011 time series of NDVI (Normalizes Difference Vegetation Index) ten-day synthesis data set from the satellite SPOT-VEGETATION. We tested whether the dynamic growth pattern of the NDVI has changed due to climate variability, and we tested the relationship of NDVI with temperature and available soil-water (ASW). In order to do so, we used a time–frequency approach based on Kalman filter regressions in the time domain. We found that individual seasons undergo cyclical changes that are different from other seasons.
We modelled cyclical satellite based grassland growth rate with a time-frequency approach. It provides the cyclical properties of the satellite based growth rate and what cycles in particular are explained by the climate variables. The cyclical analysis revealed that there are more than just seasonal cycles working for the NDVI based vegetation growth (Fig.1). We could show that the cyclical properties of NDVI are not constant over time.
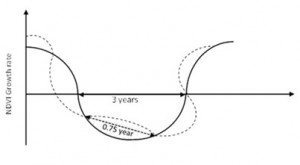
Figure 1.Graphical interpretation of NDVI growth cycles. There are two main cycles: one has a length of 3 years (solid line), and there is a shorter one of 0.75 year (dashed line).
In order to analyze the NDVI-based growth rate sensitivity of the model, a number of simulations about changes in temperature and ASW were computed (Fig.2). Our analysis showed that temperature and ASW are the main drivers of vegetation growth. We could also recognize a shift of the relative importance away from temperature to soil water. Despite soil water explaining about 50% of short-term cycles, temperature still explains about 90% of those cycles.
The perennial nature of grasslands and the extensive management of soil nutrient cycles (no fertilizers added) means that soil organic matter (SOM) is a main source of soil nutrients and thus carry effects from year to year should be expected. Our study also shows that grass growth rates depend both on the immediate impact of the spring temperature as well as the spring temperature from the previous year. As such, we hypothesize that the soil organic matter dynamics and nitrogen cycle are intimately coupled and temperature in mountains meadows colimits this process so that it extends for several years.
The results support the hypothesis that vegetation dynamics are physiologically dependent in several ways on the previous years. Therefore, a time-varying spectral approach, capable of separating out changes at different cyclical frequencies and points in time with respect to grassland growth, will need to provide the flexibility to capture these features and the important ecophysiological information contained therein.
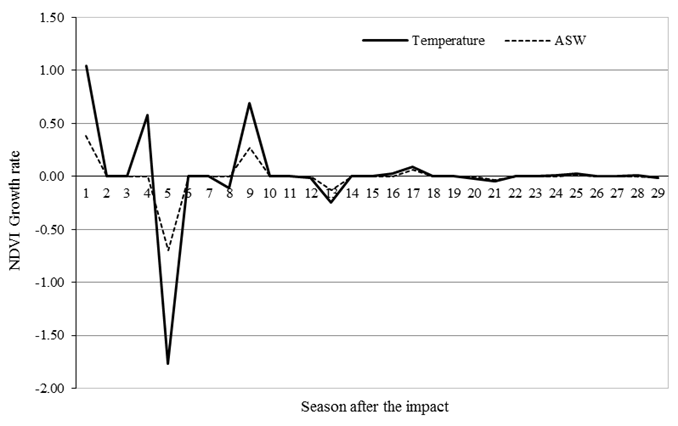
Figure 2. Simulation of the long term effects on the NDVI growth rate of a 10% change in the temperature and available soil water (ASW).
The innovative approach proposed provides the cyclical properties of the satellite based growth rate and what cycles in particular are explained by the climate variables. While this time-frequency approach of satellite based vegetation growth cycles can only give indications of causal relationships on potential climatic growth impact, they provide the catalyst for causal hypothesis generation, namely for the plant soil-interactions, which could be tested where other data-sources are available. The quantification of the relative impact of these myriad factors on the grassland dynamics, as in other crops, is still a huge challenge for developing strategies for the sustainable use of agricultural worldwide.
The results of this case study are now published in the journal IEEE Transactions on Geosciences and Remote Sensing.
Case study 2 – Parameterization and application of a satellite-based surface energy balance (SEB) model to estimate evapotranspiration (ET) in a super-intensive olive orchard in Alentejo region
The performance of the SEB model METRIC (Mapping EvapoTranspiration at high Resolution using Internalised Calibration) for the estimation of ET in conditions of discontinuous ground cover was evaluated in this case study. A superintensive olive orchard located in Viana do Alentejo, in Southern Portugal (38º24’N, 7º43’W, 143 m a.s.l) was used as test site.
Several adjustments to the parameterization of variables considered in the model algorithms, including leaf area index, surface temperature and momentum roughness length, were tested and applied. Results obtained with the adjustments were tested against ground data. Following the parameterization results obtained, the model was used for estimating and mapping ET and subsequently crop coefficients. Figure 3 presents the results of the comparison between the ET estimated by METRIC (ETMETRIC) and ET derived from ground data (ETobs) for the study area in the years 2011 and 2012 (Figure 3). A good correlation was found, with a regression coefficient close to 1 (y=1.112) and a determination coefficient of 0.85 (n=12).
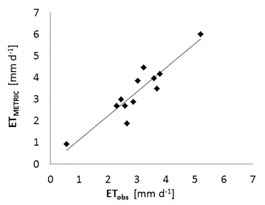
Figure 3 – Comparing crop evapotranspiration derived from METRIC algorithm (ETMETRIC) and from ground data (ETobs) (Fonte: Pôças et al.,2014a).
In a subsequent step, data from METRIC was used for estimating crop coefficients (Kc) by dividing ETMETRIC by the reference ET (ETo, corresponding to the ET of reference surface, computed using meteorological data) following the equation proposed in FAO56 by Allen et al (1998) for estimating crop ET (ETc=ETo*Kc). The results obtained were compared with the crop coefficients computed with SIMDualKc. The SIMDualKc uses the FAO 56 methodology, applying the dual approach, i.e., computing separately a daily basal crop coefficient (Kcb), representing primarily the plant transpiration, and a daily soil evaporation coefficient (Ke), i.e., Kc = Kcb + Ke. This SIMDualKc model introduces features regarding soil evaporation and a density coefficient to deal with discontinuous stands. This density coefficient adjusts the basal crop coefficient (representing plant transpiration) using a physical description of the vegetation based upon the fraction of ground covered, tree height and a parameter describing the relative importance of ET to ETo per unit of horizontal vegetation surface.
Good results were obtained by comparison of Kc derived from METRIC data (Kc METRIC) and from SIMDualKc (Kc SIMDualKc) as shown in Figure 4.
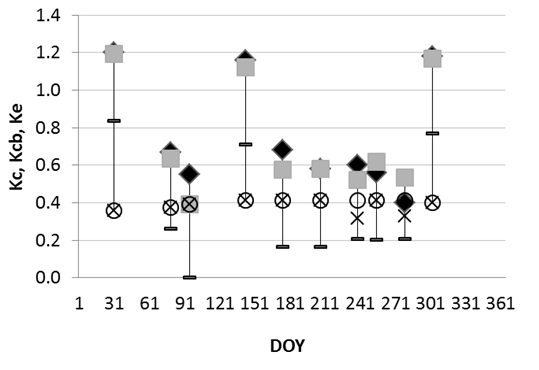
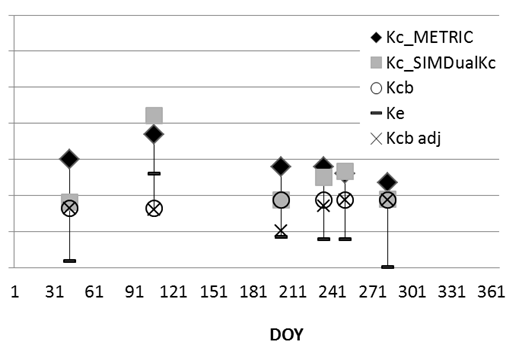
Figure 4. Daily crop coefficients (Kc) derived from SIMDualKc (Kc_SIMDualKc) and METRIC (Kc_METRIC), basal crop coefficient (Kcb), adjusted basal crop coefficient (Kcb adj) and soil evaporation coefficient (Ke) derived from SIMDualKc, in the years 2011 (left panel) and 2012 (right panel) (Fonte: Paço et al.2014; Pôças et al.,2014b).
The results of this case study are now published in two international scientific journals – Biosystems Engineering and Journal of Hydrology – and in the proceedings of an international conference.
Case study 3 – Development of a new approach for estimating crop coefficients by combining remotely sensed vegetation indices and soil water balance modeling.
ET from agricultural crops is frequently estimated using a crop coefficient approach: the ET of a reference vegetated surface (reference evapotranspiration, ETo) is affected by a coefficient (crop coefficient) reflecting crop specificities to obtain crop ET (Allen et al 1998, FAO 56).
A new procedure was developed for estimating actual crop coefficients (Kc VI) combining data from vegetation indices derived from EO data (Kcb VI) and from a soil water balance model (SIMDualKc). The methodology was tested and applied to three different crops and test sites: (i) superintensive olive orchard located in Viana do Alentejo, in Southern Portugal (38º24’N, 7º43’W, 143 m a.s.l); (ii) three maize fields located in Alpiarça, in Ribatejo region – field 1 (39°17’33″N 8°34’19″W, 14m a.s.l.), field 2 (39°17’45″N 8°34’01″W, 14m a.s.l.), and field 3 (39°18’04″N 8°32’22″W, 16m a.s.l.); and (iii) and a barley field in Alpiarça (39°17’33″N 8°34’19″W, 14m a.s.l.).
A new equation was developed for estimating actual basal crop coefficients using vegetation indices derived from EO data (Kcb VI). This new methodology considers a density coefficient and a crop coefficient for bare soil in order to allow the estimation of basal crop coefficient either to crops with continuous or discontinuous vegetation cover and to the whole crop season.
Further, to derive crop coefficients, a combined approach was considered, integrating the Kcb VI with the soil evaporation coefficient derived from the soil water balance model SIMDualKc. Additionally, the stress coefficient derived from the model SIMDualKc was also considered in this combined approach aiming to provide information about actual crop coefficients, thus adjusting to the actual crop conditions. Therefore, the SIMDualKc was used to simulate evapotranspiration and crop coefficients (the several components considered for computing the crop coefficient following a dual approach: basal crop coefficient, soil evaporation coefficient and stress coefficient).
Figure 5 shows the comparison of results obtained by the new approach and by SIMDualKc for the three crops.
The results of this case study are now published in an international scientific journal: Remote Sensing
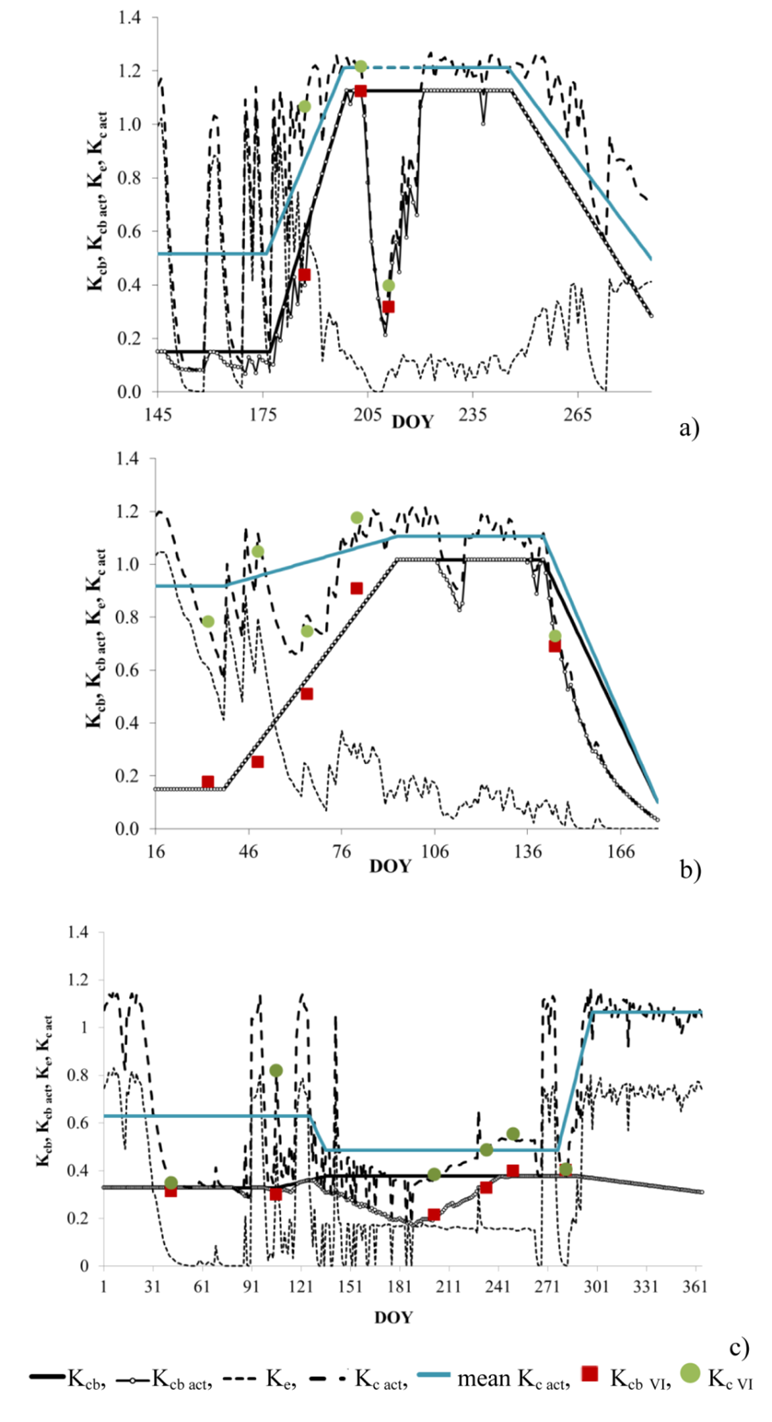
Figure 5 – Seasonal variation of the actual Kcb VI and actual Kc estimated by the combined approach (Kc VI) and of the daily coefficients Kcb, actual Kcb (Kcb act), Ke and actual Kc (Kc act) obtained with SIMDualKc for: (a) maize, field 1- year 2010, (b) barley, year 2012, and (c) olive orchard, year 2012 ( Fonte : Pôças et al.,2015).
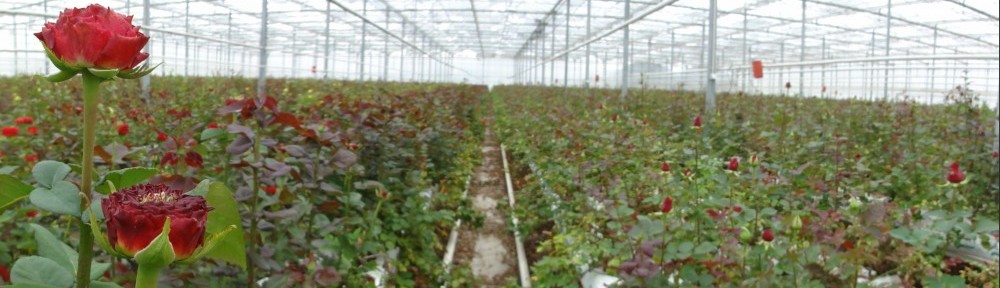
Case study 4 – Monitoring rose crop in a greenhouse using proximity sensors and digital images
A new model for estimating the plant leaf area in roses was developed based on digital images and on biometric parameters. A non-destructive leaf area acquisition system was designed for this purpose. The new model showed a good performance (Figure 6).

Figure 6 – Comparison of the leaf area observed (lnAF observed) and the leaf area estimated by the new model (lnAF estimated) (Fonte: Costa, 2014; Costa et al.,2014).
Data obtained with the leaf area model were combined with other crop parameters, meteorological parameters and thermal images data to obtain an innovative model for estimating daily crop ET (ETc) in roses grown in a soilless cultivation system. Results obtained with this model were successfully tested against data recorded by weighting lisimeters specifically designed and adapted for the crop system under study (Figures 7 and 8).

Figure 7: Scheme of a load lysimeter (A) and a load lysimeter image (lysimeter metallic structure and the support of the monocell platform) (B)
Additionally, data resulting from the leaf area model were also considered in combination with temperature data for the definition of a new approach for determining the accumulated radiation, aiming to support the ETc estimation and scheduling of irrigation. Based in this model, a computational application was developed and is currently available at the AGRISAT XXI website.

Figure 8: Comparison of the daily evapotranspiration values observed (ETc observed) and the values estimated by the new model (ETc estimated).
Thermal infrared data were also collected using a thermal camera (Figure 9). Data obtained with these proximity sensors allowed relating the foliage temperature and the crop evapotranspiration (Figure 10).

Figure 9. Rosebush´s canopy and greenhouse thermal image
The results of this case study are now published in a MSc dissertation and in the proceedings of an international conference.

Figure 10. Canopy temperature and crop evapotranspiration in two periods of the days during July to September
The results of this case study are now published in a MSc dissertation and in the proceedings of an International Conference.
Case study 5 – Crop monitoring of vineyard using EO data and ground data
For this case study, a study area in Soutelo do Douro, Douro region (41º12’33’’N, 7º26’04’’W, 137 m a.s.l.), and another in Algeruz, Ribatejo region (38º35’N, 8º 49’ W, 25 m a.s.l.) were considered.
(i) Regarding the vineyard in Douro, different crop water conditions were monitored using both ground data and EO data from sensors Landsat 7 and Landsat 8.
Reflectance data and thermal data (Figure 11) were collected at field level and then used to derive various vegetation indices (VI). Several VIs were also computed using EO data. The VIs computed were tested against data of predawn leaf water potential in order to evaluate their adequacy to detect crop water status.
 Figure 11: (A) vineyard canopy and soil thermal images
Additionally, the non-destructive leaf area acquisition system developed in case study 4 was also applied in this case study to determine the leaf area of grapevine (Figure 12).

Figure 12: Image acquisition of grapevine’s leaves for determining of the leaf area.
The approach implemented in case study 3 for estimating crop coefficients (Kc VI) was also applied in this case study. Two water balance models (SIMDualKc and VIMS) were tested to obtain information about crop stress coefficient and evaporation coefficient which were used in combination with Kcb VI data to compute actual crop coefficients.
Additionally, a second vineyard site in the South of Portugal (Algeruz) was considered. This vineyard has an haplic arenosol soil (FAO, ISSS Working Group RB, 1998), with sandy texture and soft sandstone at 1 m depth; the total available water is 40-50 mm m-1 with a bulk density varying between 1.6 and 1.8 g cm-3. The sandstone layers present lithological discontinuities that allow the root development, contributing to plant water uptake during summer dry periods. The vineyard variety is Syrah with a plant density of 2975 plants per ha and a N-S row orientation. The vineyard was drip irrigated with an emitter for each plant (flow equal to 2.3 dm3 h-1). During 2002 took place 10 irrigation events, each with duration of 2 h, corresponding to 46 dm3 for each plant (close to 14 mm).
According to Köppen classification the climate is a Csa (Mediterranean climate). Figure 13 presents the meteorological conditions measured in the site, during the irrigation season in 2012.

Figure 13 – Meteorological conditions during the irrigation season, at the field site in 2012. (Rn – net radiation, Tmean – mean air temperature, u – mean wind speed, HRmean – mean temperature, DOY – day of the year.
Ground measurements previously performed in this site in the years 2001 and 2002 were used to calibrate and validate the SIMDualKc model. Figure 14 presents some of the meteorological sensors installed in the test site.

Figure 14 – Some meteorological sensors installed in the field plot at Algeruz.
Transpiration data obtained with a sap flow technique at Algeruz site was used to calibrate the SIMDualKc method. The SIMDualKc model was used to simulate evapotranspiration and provide information for comparison with remote sensing data. Other measurements of evapotranspiration and soil water content will be used to test the model after validation. Data from daily evapotranspiration (ET) was measured during July 2002 using the eddy covariance technique. Plant transpiration was measured using the Granier sap flow method from May to November in 2002. Soil water content was monitored from May to December in 2002 and from July to November in 2001. Meteorological data from a nearby weather station (Moinholas) was used to compute reference evapotranspiration (ETo) with the SIMDualKc model.
SIMDualKc model was calibrated with 2002 transpiration data and preliminary results are showed in Figure 15. Model calibration consisted in determining the parameters values that better describe the crop and its environmental conditions, mainly the basal crop coefficients Kcb and the depletion fraction for no water stress (p) relative to the initial-, mid- and end-season crop stages, the ML factor and the soil evaporation parameters TEW, REW and Ze. Calibration was performed by progressively changing parameters to minimize the differences between observed and simulated transpiration (Tobs and Tsim). As a starting point, simulations were made regarding the ML and p parameters and the results obtained are showed in Fig. 15 (lower panel).
The presence of a groundwater table that was accessible by plant roots, introduced some difficulties in the simulations, since the SIMDualKc doesn’t account for this situation. Therefore, a larger root depth then the initially considered (1 m, as the depth of the sandstone layer) was adopted, given that the lithological discontinuities present in the sandstone allow the penetration of roots until 3 m depth. Also, a smaller value for parameter p was considered during the mid season period, having in mind the lowering of the groundwater table during this period.

Figure 15 – Plant transpiration simulated with SIMDualKc model (Tsim) and measured with the sap flow Granier method (Tobs); starting point of calibration (upper panel) and best preliminary fit (lower panel). Preliminary results.
After obtaining the final calibration results, the validation phase will follow, using for this purpose soil water content data. This is expected to be available in a short term period.
The evapotranspiration data and crop coefficients obtained after the procedures of calibration and validation of SIMDualKc model for the vineyard test site will be used for comparison with remote sensing data, in specific for comparison of the results obtained by the Kc VI approach (implemented in case study 3)
Final results of these case studies are still being analyzed.
Case study 6 – Evaluation of agronomic and biophysical parameters of different crop systems in a maize study area in Entre Douro e Minho region
For this case study, a maize field in Vila do Conde (41º21’40’’N, 8º40’33’’W, 71 m a.s.l.) was considered. This research study compared three different densities at two different spatial arrangements: conventional single row crop system vs twin row crop system (Figure 16).
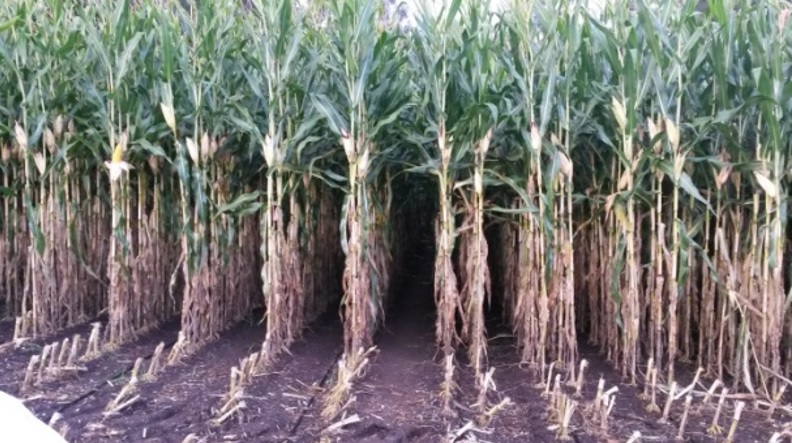
Figure 16. Experimental field to compared three different densities at two different spatial arrangements in a maize crop field
The main goal of this case study was to determine whether the twin-row spatial arrangement is a feasible management practice to achieve higher optimum plant densities for maize. The performance of several agronomical and biophysical parameters was tested, including parameters related with the plant architecture and the crop water requirements.
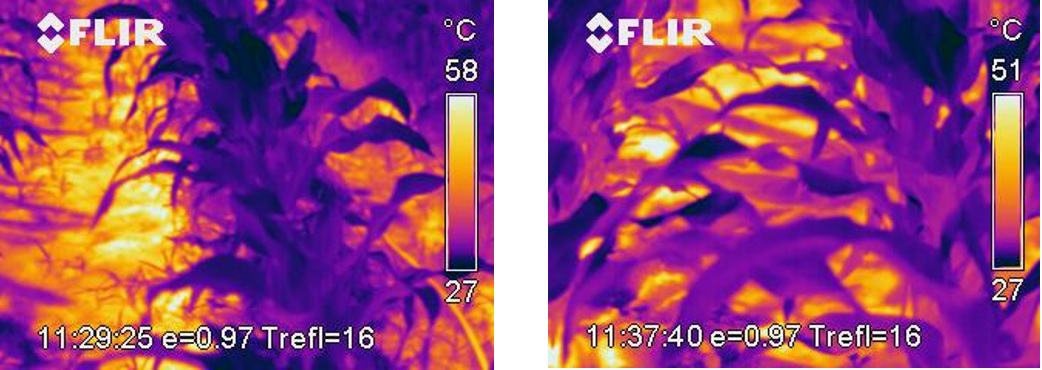
Data collected from field spetroradiometer, thermal camera and drone images were used for understand the response of diverse morpho-physiological traits and efficiency of resources used (e.g. radiation, water) to the different plant densities and spatial arrangements (Figure 17). Drone images were also used to access plant uniformity in the field and to extracted vegetation indices related to crop morpho-physiology.
(i)
 (ii)
(ii)
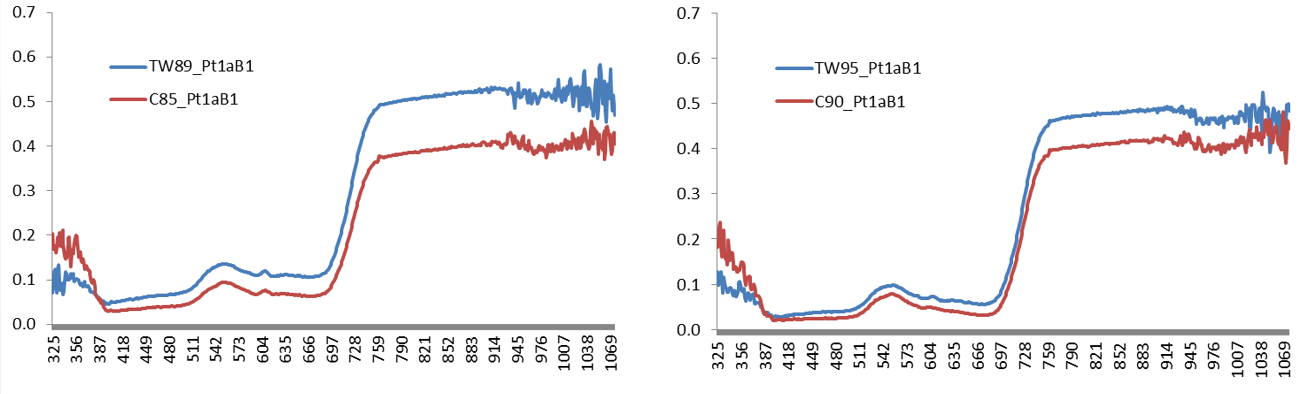
(iii)
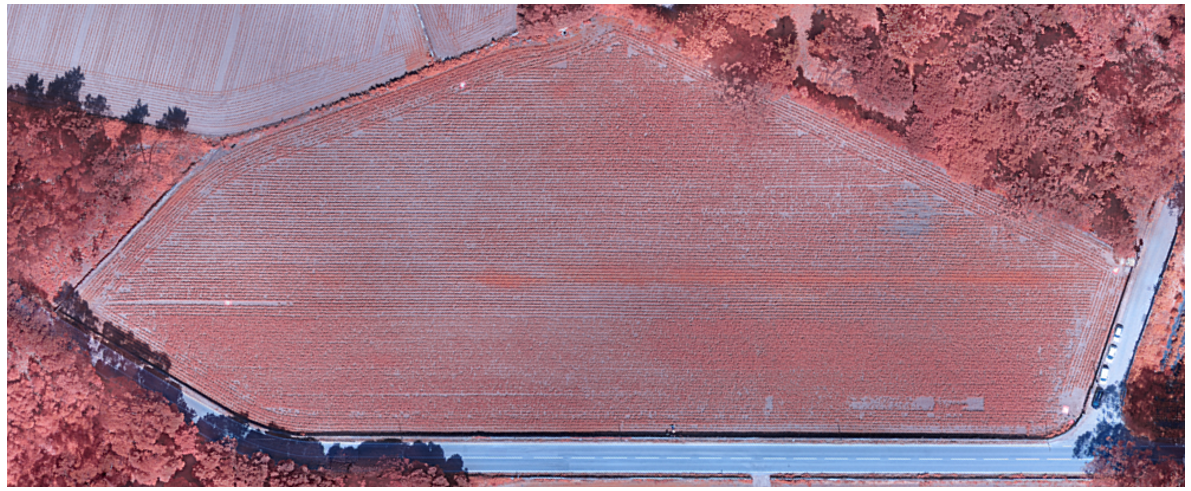
Figure 17. Data collected in the maize study area: (i) Thermal imagery collected over a single row (left panel) and a twin row (right panel); (ii) Reflectance data collected over single row (C) and a twin row (TW) for low plant density (left panel) and high plant density (right panes); and (iii) Orthophoto of the maize field obtained with a Drone flying about 90 feet high.
Final results of this case study are still being analyzed, and will be integrated into a master’s thesis ongoing.

![]()
![]()
![]()